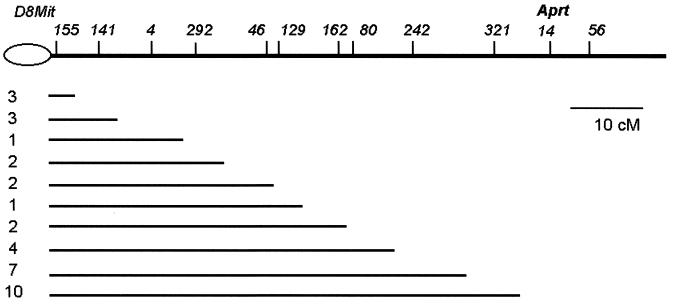
Figure 2.
Intervals of LOH in class I clones. The lines correspond to the interval for which the SSR markers remained heterozygous. All markers right to the lines exhibited LOH. The number of independent events in each group is shown on the left. The map positions of the SSR markers are according to Mouse Genome Database [http://www.informatics.jax.org (6/98)].

