Figure 1.
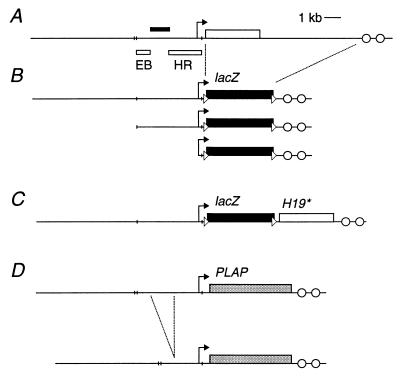
Structure of the H19 genomic locus and reporter transgenes. (A) The H19 gene is depicted by the open rectangle with the arrow indicating the promoter (internal exon/intron boundaries not shown). The downstream enhancers are represented by open circles. The filled rectangle above the horizontal line indicates the position of the silencer region identified in Drosophila (20). The open rectangles below the line show the probes EB and HE that were used for methylation analysis. The short vertical lines indicate EcoRI sites. (B) H19–lacZ transgenes with −10.5 kb, −3.8 kb, and −0.25 kb of upstream region (HGF23, HGF22, and HGF21, respectively). The filled rectangle represents the bacterial lacZ gene and the dashed lines show the region of the wild-type locus that has been replaced by the reporter. The loxP sites are depicted by triangles. (C) HGF20 transgenes were identical to HGF23 except that a 4-kb H19 genomic fragment containing an artificial polymorphism was inserted downstream of the lacZ poly(A) and 3′ loxP site. (D) H19–PLAP and DEL–H19 transgenes with and without the silencer region. The gray rectangles depict the human PLAP genomic reporter (internal exon/intron boundaries not shown). The dashed lines show the 1.2-kb BspEI–BamHI deletion and the resulting DEL–H19 transgene has −9.3 kb of remaining upstream region.

