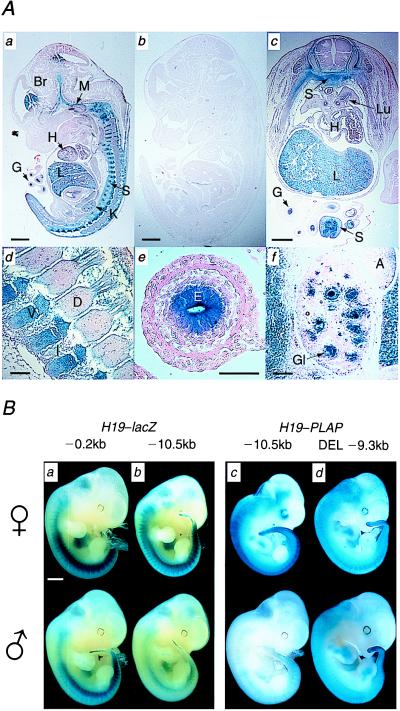
Figure 2.
(A) PLAP reporter gene expression in FL16 day 13.5 embryo after maternal and paternal transmission. (a) Midsagittal section after maternal transmission shows strong staining in liver, sclerotome, brain, meninges, and gut endoderm. Low levels of expression are seen in the heart. (b) Midsagittal section after paternal transmission shows complete repression of PLAP activity. (c) Transverse section through lower thoracic region after maternal transmission. The PLAP staining clearly shows the developing sclerotome, which is migrating dorsally to form the vertebral bodies and ventrally to form the cartilage and bones of the thoracic ribs. There is no expression in the spinal cord or dermatomyotome. Extracoloemic gut shows strong endothelial staining and some expression is also seen in the heart and bronchial epithelium of the lung. (d) Parasagittal view of upper thoracic vertebral column showing the formation of the vertebral bodies and intervertebral discs. (e) Sagittal section through extracoloemic gut showing high-level expression in the endoderm-derived endothelium. (f) Sagittal section through kidney showing PLAP expression in the developing glomeruli, but not in the tubules. Scale bar indicates 1 mm in a, b, and c and 0.1 mm in d, e, and f. A, adrenal gland; Br, brain; D, dorsal root ganglion; E, gut endothelium; G, gut; Gl, glomerulus; H, heart; I, intervertebral disk; L, liver; Lu, lung; K, kidney; M, meninges; S, sclerotome; V, vertebral body. (B) Repression of H19–lacZ and H19–PLAP transgenes requires the silencer region. Representative day-11.5 transgenic embryos stained as whole mount specimens for lacZ or PLAP activity after maternal (Upper) or paternal (Lower) transmission. The size of upstream region in the transgenic line is shown above the panel. (Scale bar indicates 1 mm.) The level of expression of the reporter gene was quantitated byusing Scion Image software (Scion, Frederick, MD). The mean density values for the embryos depicted were normalized against an equivalent embryo with no staining. (a) Line SCB01 shows very slight repression after paternal expression. Maternal expression = 64.41. Paternal expression = 62.04. (b) Paternal transmission of line MLK16.1 shows marked repression of lacZ, most notable in the sclerotome. Maternal expression = 55.16. Paternal expression = 34.64. (c) Line FL8 shows strong repression of PLAP after paternal transmission. Some activity can be seen in the caudal sclerotome. Maternal expression = 98.90. Paternal expression = 22.19. (d) Line DEL24, which does not contain the 1.2-kb silencer, shows minor repression on paternal transmission. Maternal expression = 109.05. Paternal expression = 102.65.

