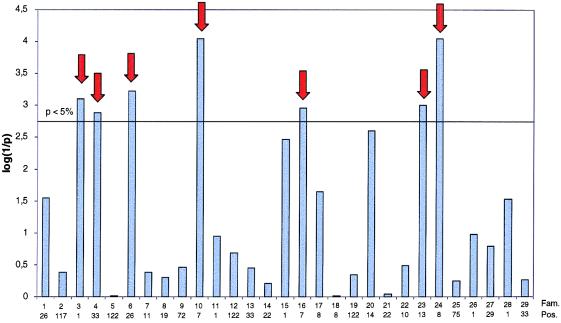
Figure 3.
Maximal log(1/p) values (obtained by chromosome-wide phenotype permutations) for fat percentage in each of the 29 analyzed half-sib families by using a previously described rank-sum approach (7). The experiment-wide significance levels obtained by Bonferroni correction accounting for the analysis of multiple (29) families is shown as a horizontal line. Numbers underneath the bar graph correspond to family number and most likely chromosome position (cM). The selected families are indicated by the red arrows.

