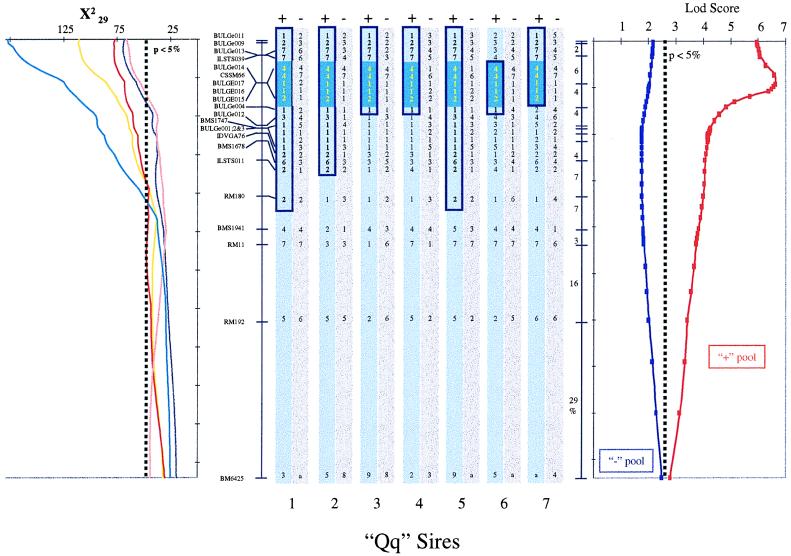
Figure 4.
Identification of a shared haplotype in the + pool of Qq sire chromosomes. The graph on the left shows the location scores obtained along the marker map of BTA14 for milk yield (yellow line), protein yield (red line), fat yield (purple line), protein percentage (pink line), and fat percentage (blue line) by using the hsqm analysis software (7, 8). The location scores are expressed as χ2 statistics with 29 degrees of freedom. The experiment-wide threshold associated with a type I error of 5% is shown. Order and recombination rates between microsatellite markers and SNPs composing the BTA14 linkage map are given. The vertical bars in the center illustrate the genotypes of the seven postulated Qq sires. The gray bars correspond to the chromosomes of the − pool, while the blue bars correspond to the + pool. The postulated ancestral chromosome carrying the Q QTL allele is boxed in dark blue, while the chromosome segment shared identical-by-state by all seven sires is filled dark blue. The graph on the right illustrates the results obtained with dismult (21), measuring the statistical significance of the haplotype sharing observed in the + and − chromosome pools as a lod score. The experiment-wide threshold associated with a type I error of 5% as obtained by permutation is shown.

