
Figure 3.
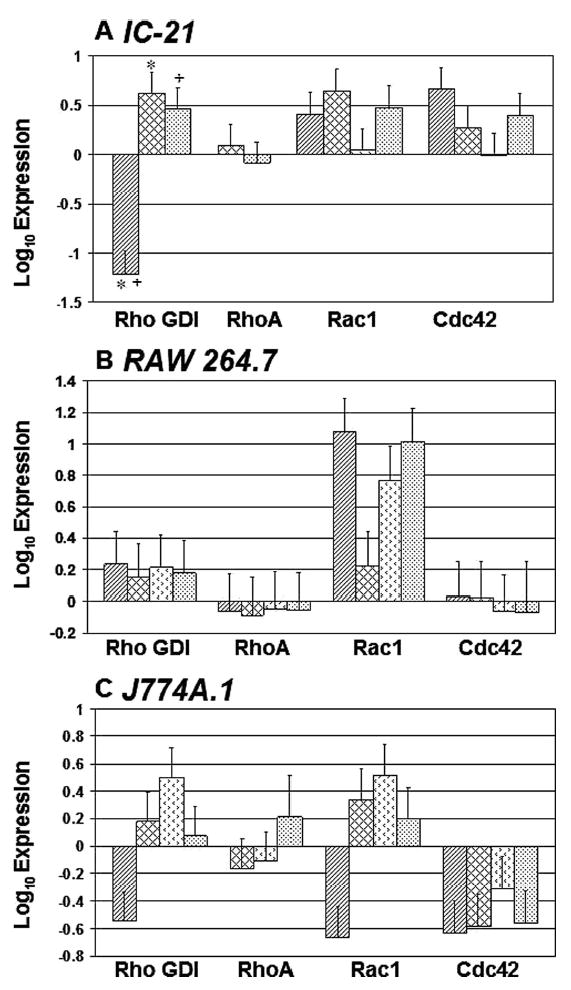
Rho GTPase expression comparison for (monocyte-) macrophage cell lines
cultured on control (TCPS, PS) and model (PLA,
Teflon® AF) surfaces. Protein expression was
normalized to a whole cell lysate for the protein of interest. Error bars
represent standard error of the mean, n =
3–8. Only two significant pairings (P <
0.05) were noted, and they are indicated by a * or a
+, respectively (panel A). Key: ▨
TCPS, ▩ PS,  PLA,
Teflon® AF.
PLA,
Teflon® AF.