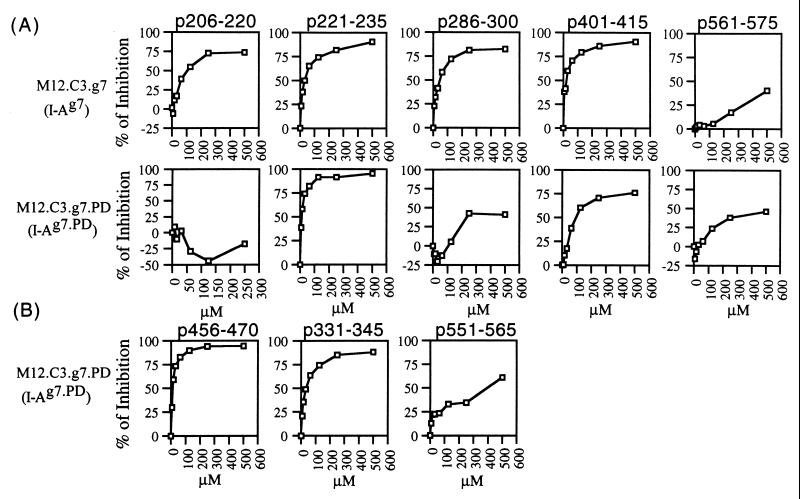
Figure 3.
The binding of g7 (A) and PD (B) epitopes to I-Ag7 and I-Ag7.PD molecules. M12.C3.g7 and M12.C3.g7.PD cells were used, respectively, as binding targets in this competitive peptide/MHC-binding assay. The inhibitory peptides are shown on the top of each pair of experiments. The x axis represents various concentrations (μM) of inhibitory peptides, and the y axis represents the percentage of inhibition, which was calculated by the following formula: % of inhibition = [(R − R1)/R] × 100%, where R = signal from assays containing only reference peptide, and R1 = signal from assays containing reference peptide and inhibitory peptide.

