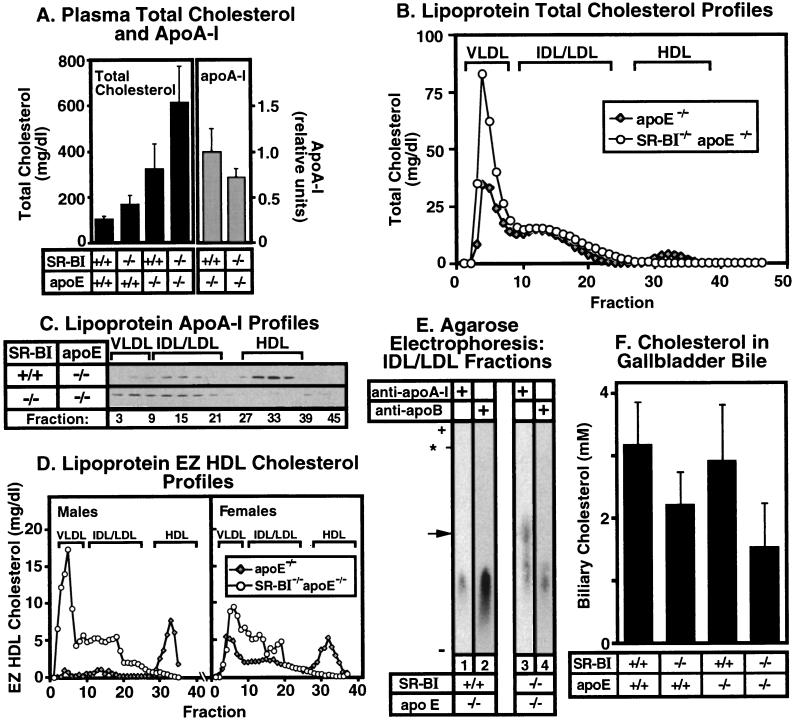
Figure 2.
Effects of SR-BI gene disruption on plasma lipoproteins in apoE KO mice. Mice were 4–7 weeks old. (A) Plasma total cholesterol levels (Left, mean ± SD) for wild-type (n = 5), SR-BI−/− (n = 12), apoE−/− (n = 12), and SR-BI−/− apoE−/− (n = 9) females (P < 0.0002). Plasma apoA-I levels (Right, mean ± SD, expressed as relative units) were determined by SDS/PAGE (15%) followed by quantitative immunoblotting for apoE−/− (n = 7) and SR-BI−/−apoE−/− females (n = 5) (P = 0.1). (B) Lipoprotein cholesterol profiles. Plasma lipoproteins from individual apoE−/− (shaded diamonds) or SR-BI−/− apoE−/− (○) females were separated based on size (Superose 6-FPLC), and total cholesterol in each fraction (expressed as mg/dl plasma) was measured. The chromatograms shown are representative of multiple, independent determinations. Approximate elution positions of VLDL, IDL/LDL, and HDL are indicated as described previously (17, 18). (C) Lipoprotein apoA-I profiles. Pooled Superose 6-FPLC fractions (see above, ≈21 μl per pool) from females in an independent experiment were analyzed by SDS-polyacrylamide gradient (3–15%) gel electrophoresis and immunoblotting with an anti-apoA-I antibody (18). Each pool contained three fractions, and lanes are labeled with the number of the middle fraction in each pool. (D) Average EZ HDL cholesterol FPLC profiles for apoE−/− (diamonds) or SR-BI−/− apoE−/− (○) males (Left, n = 3) or females (Right, n = 3). (E) Agarose gel electrophoresis and immunoblotting. Pooled fractions (fractions 11–21; 3.5 μl) from the IDL/LDL region of the lipoprotein profile from individual apoE−/− or SR-BI−/− apoE−/− females were analyzed by using either anti-apoA-I or anti-apoB antibodies. The position of migration of normal-sized HDL is indicated by the asterisk. The arrow on the left indicates the mobility of the apoA-I-containing, apoB-free particles from double KOs (lane 3). Migration was upward from negative to positive (origin not shown). (F) Gallbladder biliary cholesterol (mean ± SD). Total gallbladder biliary cholesterol from both male and female mice of the indicated genotypes (n = 10 or 11 per genotype) was measured. Except for the wild-type and apoE−/− values, all pairwise differences were statistically significant (P < 0.025–0.0005).

