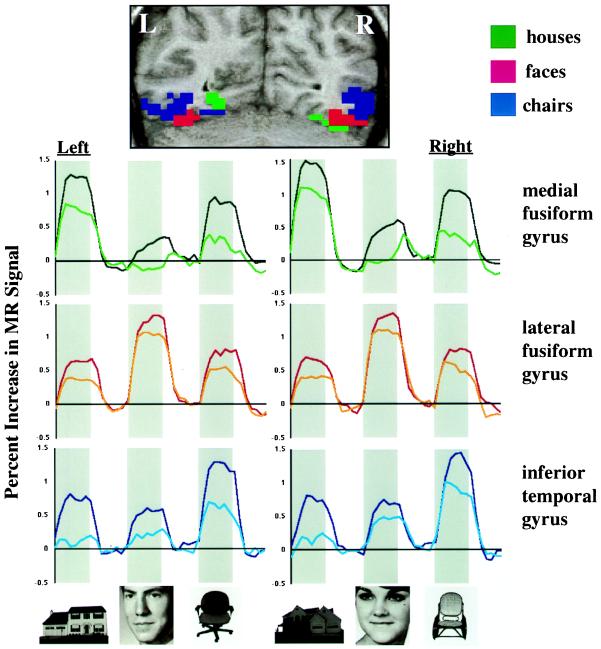
Figure 1.
Response topographies in ventral temporal cortex in Experiment 1. (Top) Locations of three posterior ventral temporal regions that responded differentially to houses, faces, and chairs, illustrated in a coronal section (y = −65) from a single subject. Voxels shown in color demonstrated a significant overall experimental effect (Z > 4.0) and a significant difference among responses to houses, faces, and chairs (Z > 1.96, clusters of seven or more voxels). Regions showing maximal responses to houses, faces, and chairs are shown in green, red, and blue, respectively. (Bottom) Mean time series for these three ventral temporal regions. Data are averaged across six subjects and 12 repetitions of task blocks in each subject. Gray bars indicate presentation of meaningful stimuli. The white space to the right of each gray bar indicates the presentation of control stimuli. The darker colored line in each graph is for the delayed match-to-sample task, and the lighter line is for the passive viewing task.

