
Figure 2.
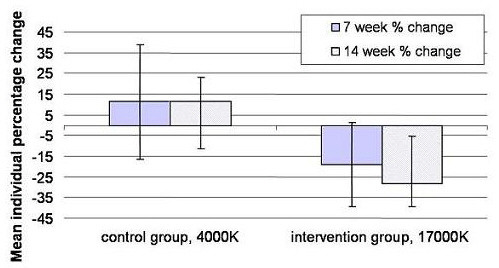
Percentage change in reported 'trouble concentrating or thinking clearly' during the preceding 3 days. The plot shows data from 7 and 14 weeks after baseline in control and intervention groups (error bars represent 95% confidence interval for the mean change).