
Figure 3.
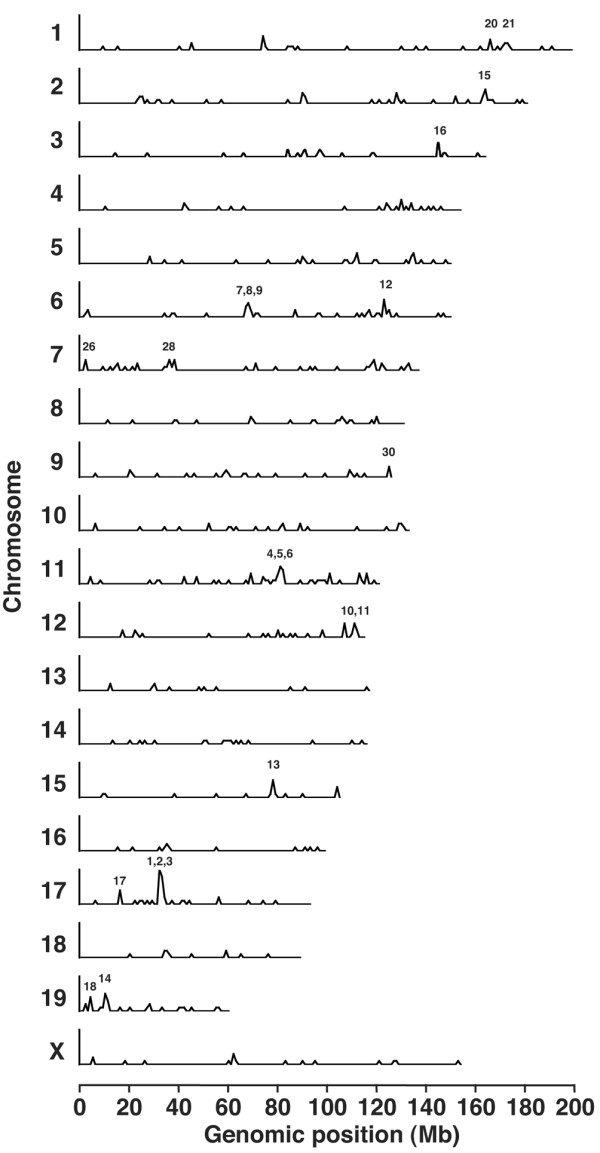
Transcriptome mapping of arthritis-related genes. Significantly changed genes were mapped in every 1-megabase (Mb) interval on each chromosome. The chromosome number is indicated in each panel; the peak number corresponds to the number given in Table 1.