Figure 1.

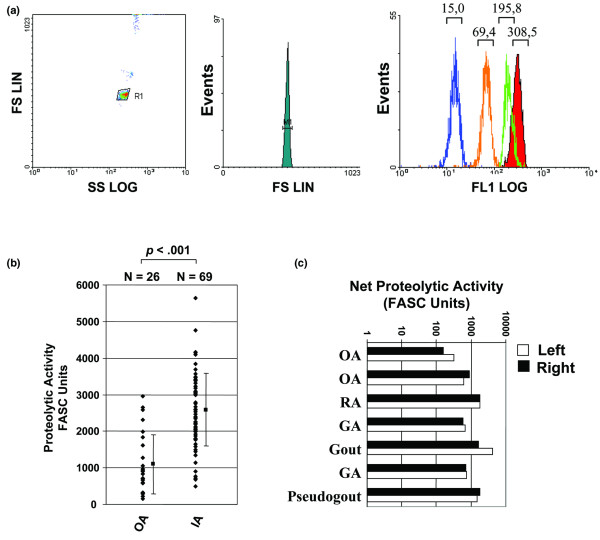
Proteolytic activity in synovial fluid of patients with osteoarthritis and inflammatory arthropathies. (a) Typical two-parameter histogram (left) with forward-angle light scatter (FS) and side scatter (SS) (y and x axes, respectively), used to position the window on microspheres (one-parameter histogram, middle) and to minimize the interference with debris. To determine the proteolytic activity in synovial fluids (SF), fluorescein isothiocyanate-labelled polypeptides derived from denatured collagen (gelatin) were coated on polystyrene microspheres (shaded) and incubated with serial dilution of synovial fluid. LIN, Linear; LOG, Logarithmic. The mean fluorescent intensity at the top of each peak is then measured on 1,000–5,000 events (right). (b) Comparison of the level of proteolytic activity found in SF obtained from 26 osteoarthritis (OA) patients and 69 patients with inflammatory arthritis (IA), including patients with established rheumatoid arthritis (RA) or undifferentiated or recent-onset polyarthritis, patients with crystal-induced arthritis, or patients with other noninfectious IA, such as ankylosing spondylitis and reactive arthritis. FASC, fluorescent-activated substrate conversion. (c) Proteolytic activity in SF collected from the left and right knees of arthritic patients on the same day. The results are representative of at least two independent experiments. GA, Gout arthritis.
