
Figure 2.
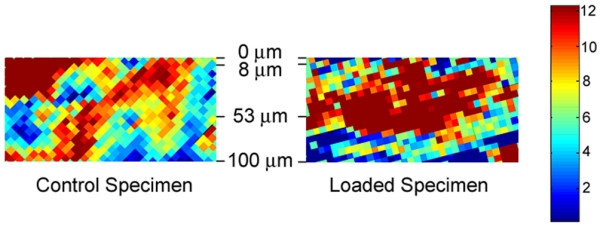
Representative Fourier Transform Infrared maps of proteoglycan in the unloaded and loaded joints of one rabbit. The superficial zone was designated from the joint surface (at 0 μm) to 8 μm from the joint surface. The mid zone was from 8 to 53 μm, and the deep zone was from 53 to 100 μm. Each image is 100 μm deep and 200 μm wide. Integrated proteoglycan peak absorbance values are pseudo-colored; red indicates that more proteoglycan is present and blue indicates that less proteoglycan is present. These maps were typical of all rabbits.