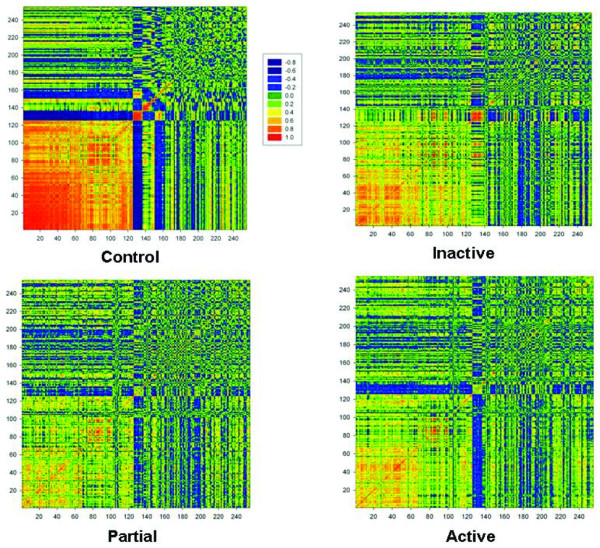
Figure 4.

Contingency analyses of neutrophils from children with juvenile rheumatoid arthritis (JRA) and controls. Control samples are represented on the top left panel. Families of genes whose expression levels correlated positively (red) or negatively (green) with one another are displayed on the grid. These same relationships are distorted in neutrophils of children with active polyarticular JRA (bottom right panel) and are only partially restored after full response to therapy (top right panel).
