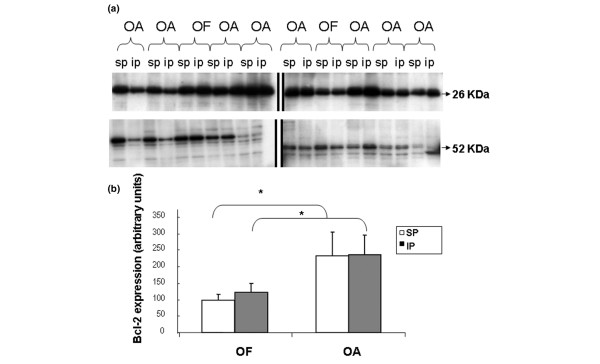
Figure 7.

Analysis of bcl-2 in OA and OF chondrocytes. Western blot of bcl-2 in OA or normal (OF) chondrocytes and comparison between areas (SP and IP). (a) Aliquots of total cell lysates were subjected to SDS-PAGE; immunoblotting was performed using anti-blc-2 antibody as described in Materials and methods. Molecular size markers are shown on the left (26 kDa = bcl2; 52 kDa = Tubulin). Data are representative of four separate experiments. (b) Percentage of basal protein expressed as arbitrary densitometric units. Levels of bcl-2 protein were significantly higher in OA cartilage than in normal cartilage. IP, inferior pole; OA, osteoarthritis; OF, osteoporotic fracture; SP, superior pole.
