
Figure 2.
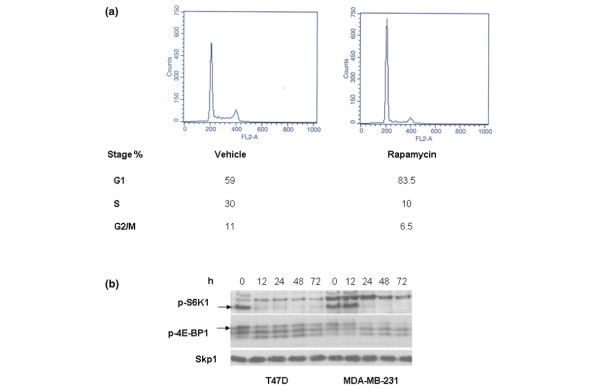
The effect of rapamycin on cell cycle profile and mTOR activation. (a) The effect of rapamycin on cell cycle distribution. T47D cells were treated with rapamycin (20 nM) or DMSO (0.02%) for 24 h and subjected to FACS analysis to determine the distribution of the cell cycle. (b) The effect of rapamycin on the phosphorylation of the mTOR effectors p-S6K1 and p-4E-BP1. The breast cancer cell lines T47D and MDA-MB-231 were treated with rapamycin (20 nM) for different time periods and the phosphorylated forms of the proteins was determined by western blot analysis. Skp1 was used as a loading control. Arrows indicate the specific bands.