
Figure 3.
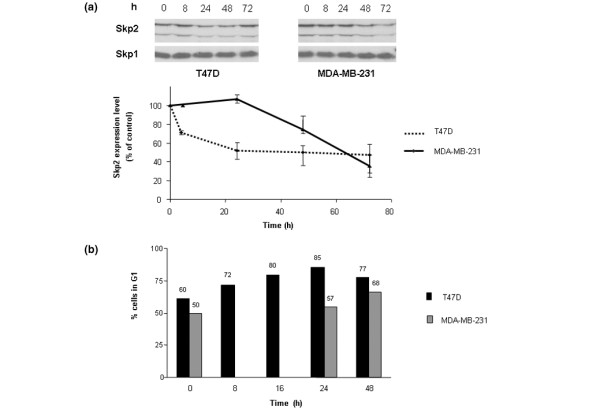
The effect of rapamycin on Skp2 protein levels and cell cycle distribution. (a) The effect of rapamycin on Skp2 protein levels. The breast cancer cell lines T47D and MDA-MB-231 were treated with rapamycin (20 nM) for different time periods and the expression of the protein was determined by western blot analysis. Skp1 was used as a loading control. (b) The time-dependent effect of rapamycin on G1 distribution in T47D and MDA-MB-231 cells. Cells were treated with rapamycin (20 nM) for different time periods and the percentage of cells in G1 was determined by FACS analysis using Modfit LT 2.0 software.