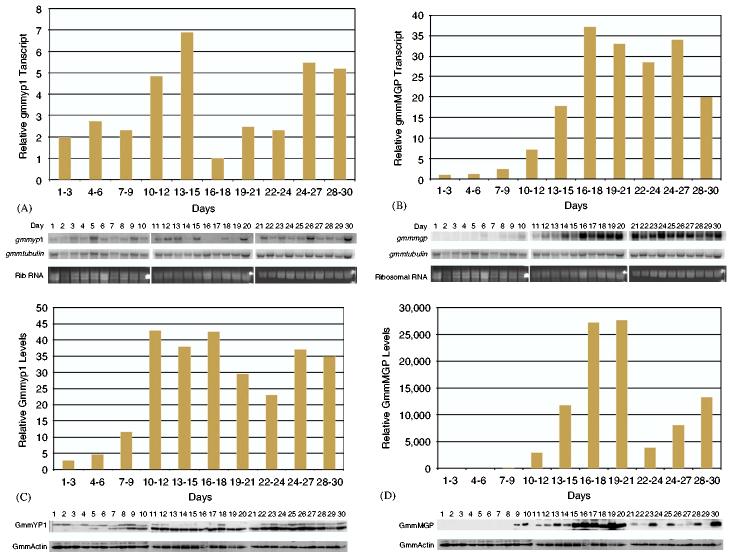
Fig. 3.
(A) Northern blot analysis of GmmYp1 expression over a thirty day time course. Each time point in the course is equal to 10 μg of total RNA collected from three individual flies for that time point. β-GmmTub was used as a loading control. Data from the Northern blots was quantitated by phosphoimager and normalized against tubulin levels. Data points on the bar graphs represent the average level of expression over a three day period. Daily data points used to generate the graph are shown in the Northern blot below. (B) Northern blot analysis of GmmMGP expression over a thirty day time course. Sample treatment and analysis is the same as in A. (C) Western blot analysis of GmmYP1 levels over a 30-day time course. Each time point in the course is equal to 10 ug of total protein collected from three individual flies for that time point. Blots were probed with polyclonal antisera specific to GmmYP1. Antibodies against Drosophila actin were used as a loading control. Data from the Western blots was quantitated by Kodak imaging software and normalized against Drosophila actin levels. Data points on the bar graphs represent the average level of expression over a three day period. Daily data points used to generate the graph are shown in the Western blot below. (D) Western blot analysis of GmmMGP levels over a thirty day time course. Sample treatment and analysis is the same as in C.

