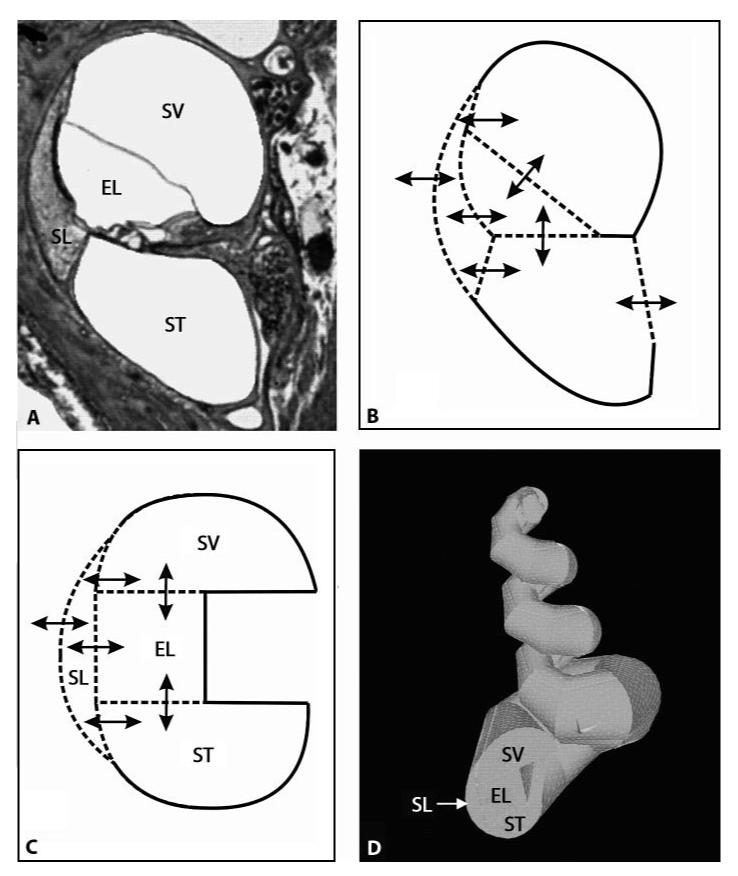
Fig. 1.
Construction of the 3D model of the guinea pig model. ST = Scala tympani; SV = scala vestibuli; ELS = endolymphatic space; SL = spiral ligament. A Cross-sectional view of one turn of the guinea pig cochlea. B Schematic showing the relevant ‘radial’ pharmacokinetic processes. Drugs are allowed to diffuse between the various compartments according to the respective concentration gradients and to the permeability at the specific border between two compartments as indicated by the arrows. C Simplified structure from B with pharmacokinetic processes incorporated into the 3D model. In addition, there is diffusion within the compartments along their longitudinal axis and through the helicotrema. D 3D model of the guinea pig cochlea in ANSYS based on the simplified cross-sectional view shown in C and on the functions describing the change of crosssectional area along distance shown in figure 2.

