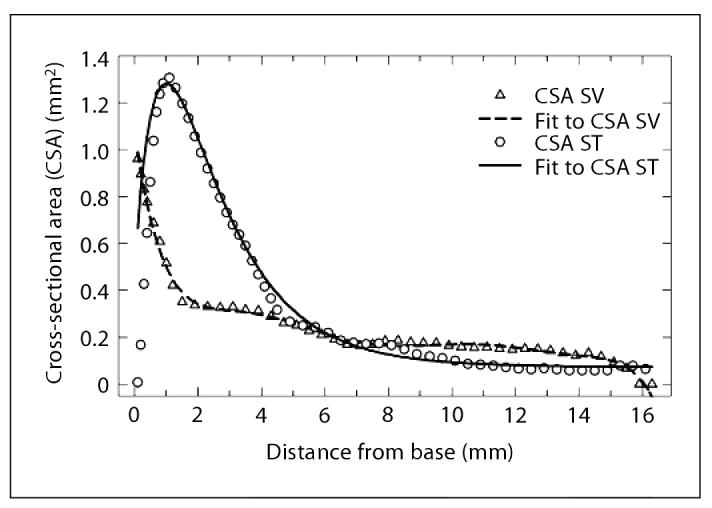
The 3D model of the guinea pig cochlea (
fig. 1D) is based on the functions describing the change of cross-sectional area (CSA) for the fluid spaces of the ST and SV area along distance as published by Thorne et al. [
1999] (open symbols) and their analytical approximation (lines). The following functions were fitted to the published cross-sectional area curves of SV and ST of the guinea pig cochlea:
The constants a
i where chosen to fit the published data.

