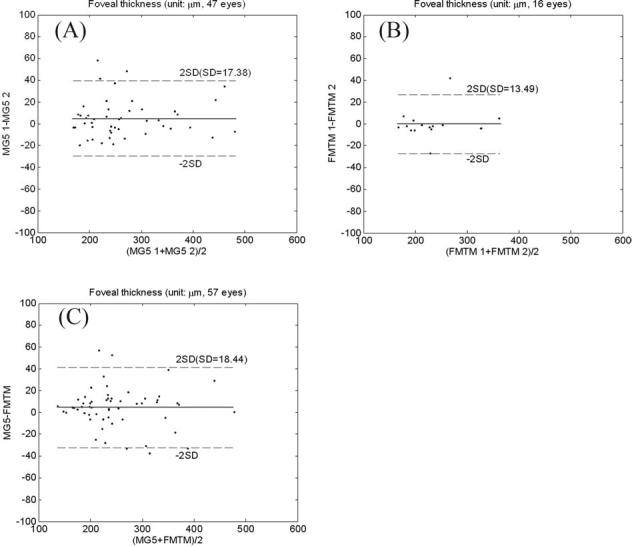
Figure 5.

Bland–Altman plot of foveal thickness (area-weighted average in the central 1-mm-diameter circle). The solid line is the average difference (or agreement), and the dashed lines are the 95% limits of agreement. A, Comparison between 2 Macular Grid 5 (MG5) scans: average difference, 4.7 μm; standard deviation (SD) of difference, 17.4 μm. B, Comparison between 2 Fast Macular Thickness Map (FMTM) scans: average difference, 0.4 μm; SD difference, 13.5 μm. C, FMTM vs. MG5: average difference, 4.5 μm; SD difference, 18.4 μm.
