
Figure 3.
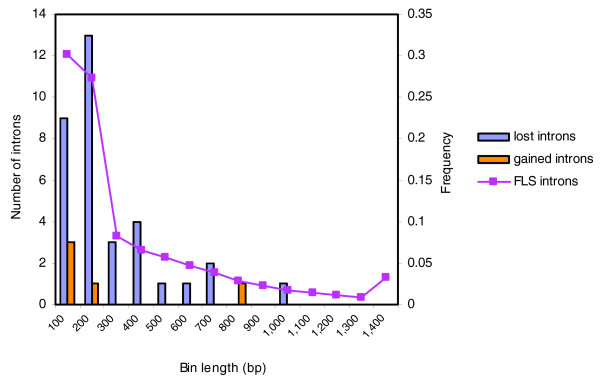
Distribution of the sizes of the lost and gained introns. Intron lengths were binned into 100 bp bins and the number of lost and gained introns in each bin was determined and plotted against the frequency of 33,011 FLS introns within the rice genome.