
Figure 3.
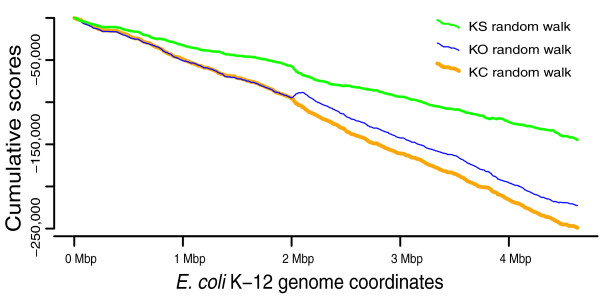
Three excursions (KS, KO, and KC) spanning the alignment with K-12 MG1655 as reference genome. The KS random walk plot, representing the dominant clonal topology, decreases more gradually than do the two other plots. Excursions for the discordant topologies (patterns KO and KC) run parallel to one another, except in a 100 kb region at 2 Mb where KO abruptly increases. Parallel flat gaps common to all three plots reflect K-12 lineage specific sequence.