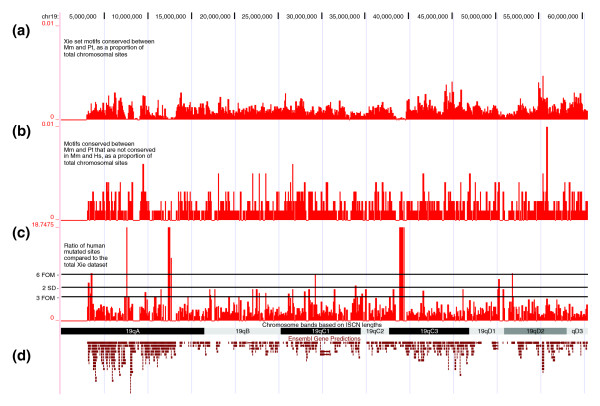
Figure 2.

Distribution of candidate TFBSs plotted against mouse chromosome 19 in the UCSC genome browser. (a) Distribution of mouse-chimpanzee conserved TFBSs. Bars indicate the number of TFBSs per 50 kb divided by the total number of TFBSs on chromosome 19. (b) Distribution of human mutated TFBSs plotted as in panel a. (c) Over-representation of human mutated sites relative to the total mouse-chimpanzee TFBS data set. Shown is the ratio b/a of the two plots above. The three horizontal lines indicate sixfold over median threshold, mean plus two standard deviations, and threefold over median threshold (from top to bottom). (d) Structure of mouse chromosome 19 with chromosome bands and Ensembl gene predictions taken from the UCSC genome browser. kb, kilobase; TFBS, transcription factor binding site; UCSC, University of California at Santa Cruz.
