
Figure 7.
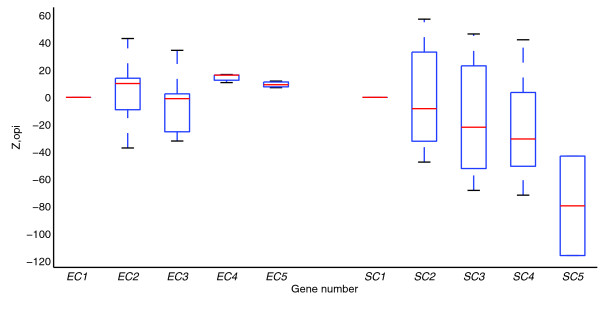
Comparative gene expression for orthologous operons. Boxplot of Zop,i scores are shown for orthologous operons, where at least one gene is the same in a documented S. coelicolor compared to E. coli. Data are shown in E. coli (EC) and S. coelicolor (SC) using all available experiments.