Figure 5.

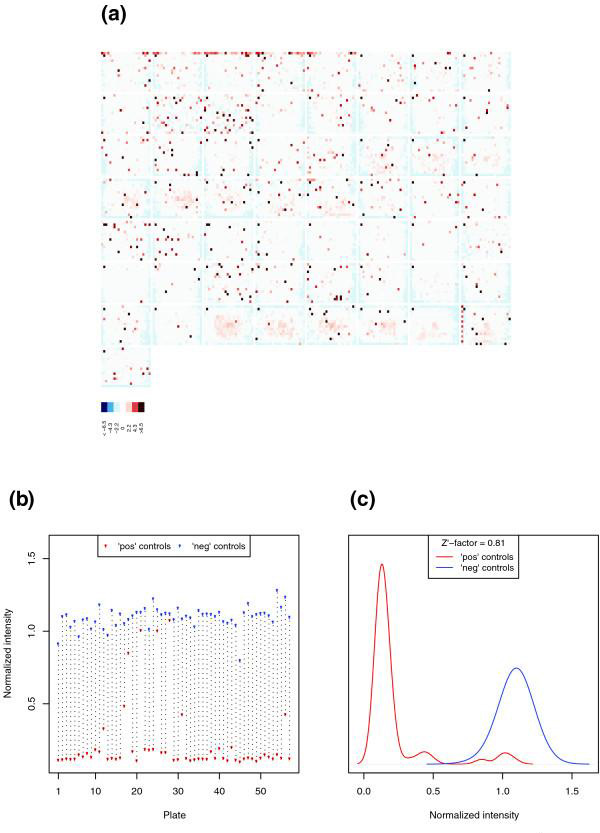
Experiment-wide quality plots. (a) Overview of the complete set of z-score values from a genome-wide screen of 21,306 dsRNAs. The dsRNAs were contained in 57 plates, laid out in eight rows and eight columns, and the 384 z-score values within each plate are plotted in a false color representation whose scale is shown at the bottom of the plot. (b) Signal from positive (red dots) and negative (blue dots) controls (y axis) plotted against the plate number (x axis). (c) Distribution of the signal from positive (red line) and negative (blue line) controls, obtained from kernel density estimates. The distance between the two distributions is quantified by the Z' factor. ds, double-stranded.
