
Figure 12.
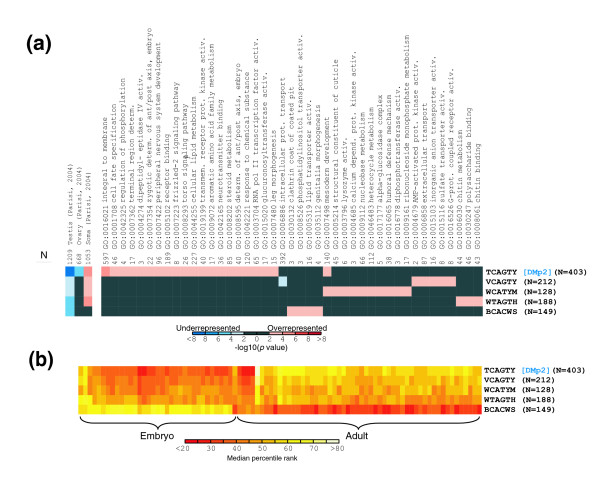
Correlations between five INR variants localized exactly at the TSS in promoters and function (GO terms and mRNA expression properties). (a) False-color image of representation bias in GO terms and mRNA expression clusters for the five variants of the INR motif in the peak. Values are calculated and displayed as in Figure 11a. The 42 most strongly correlated GO terms are shown. Note that each INR variant correlates with different GO terms. (b) False-color image of hierarchically clustered median percentile ranks of mRNA expression ratios, for previously published data for embryo and adult samples 21. Data are calculated and displayed as in Figure 1