
Figure 5.
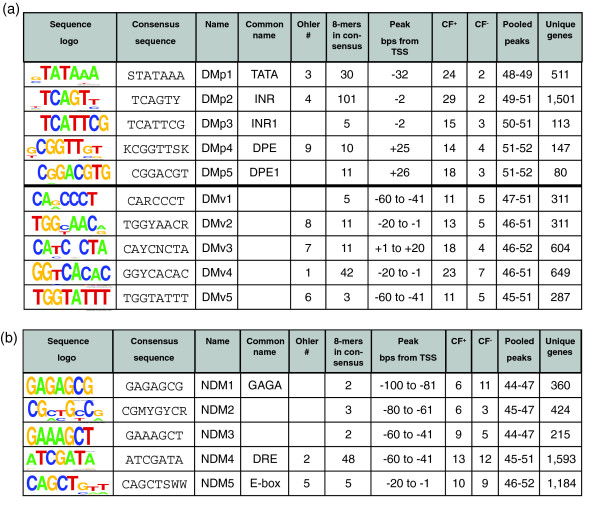
The 15 DNA motifs derived from grouping 298 octamers whose probability of having a non-random distribution was less than 1 × 10-16. The table is grouped into two panels. (a) presents the 10 directional motifs, while (b) shows the five non-directional motifs. We present: the sequence logo; the consensus sequence using IUPAC letters to represent degenerate bases - R (G, A), W (A, T), Y (T, C), K (G, T), M(A, C), S (G, C), N (A, T, G, C); the name assigned in this work; the common name if it exists; designations from previous work [10]; the number of 8-mers that peaked that were placed in the family; peak location as base-pairs relative to the TSS; clustering factor (CF+) on the positive strand; clustering factor (CF-) on the negative strand; the bins that were pooled to define the peak; and the unique genes in the peak.