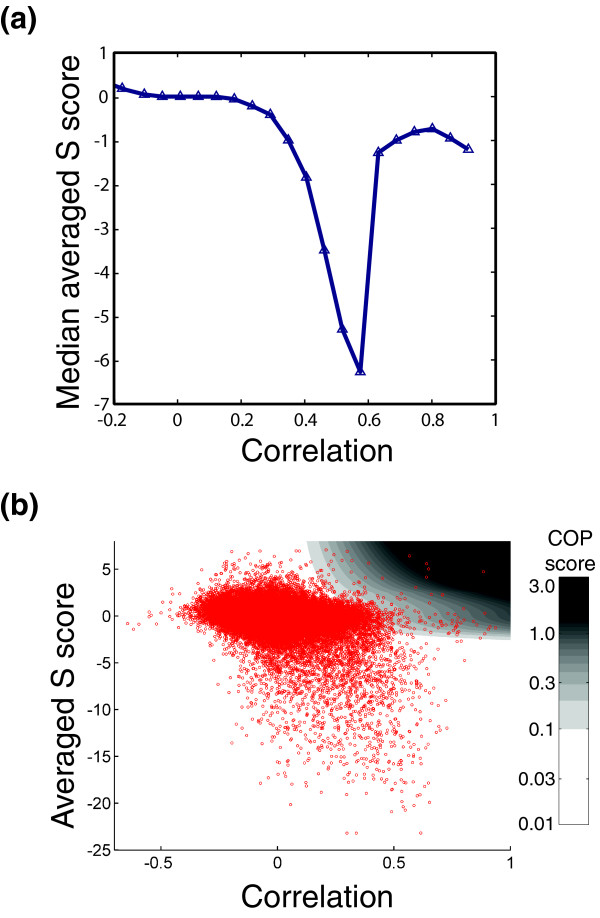
Figure 6.

A score to identify coherently acting gene pairs. (a) Plot of median averaged S score as a function of the correlation between the patterns of genetic interactions for pairs of genes. Reprinted from Schuldiner et al. [5] with permission from Elsevier 2005 (b) Scatter plot of averaged S score versus correlation in which each point represents one pair of genes. The plot is overlaid onto a color gradient indicating the COP score.
