
Figure 4.
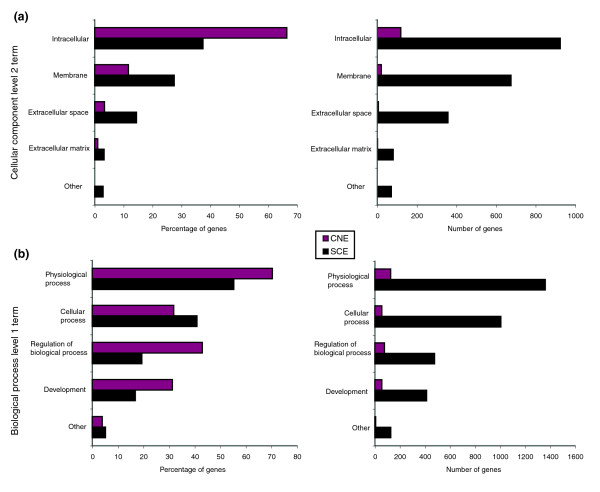
GO Classification of genes harboring CNEs versus genes harboring SCEs. All genes containing CNEs and/or SCEs were analyzed for GO term classification. Genes containing CNEs are shown in red and genes containing SCEs are shown in gray. Plots show differences in absolute numbers as well as relative percentages. Classification is shown for (a) cellular component and (b) biological process categories. CNE, conserved noncoding element; GO, Gene Ontology; SCE, shuffled conserved region.