
Figure 5.
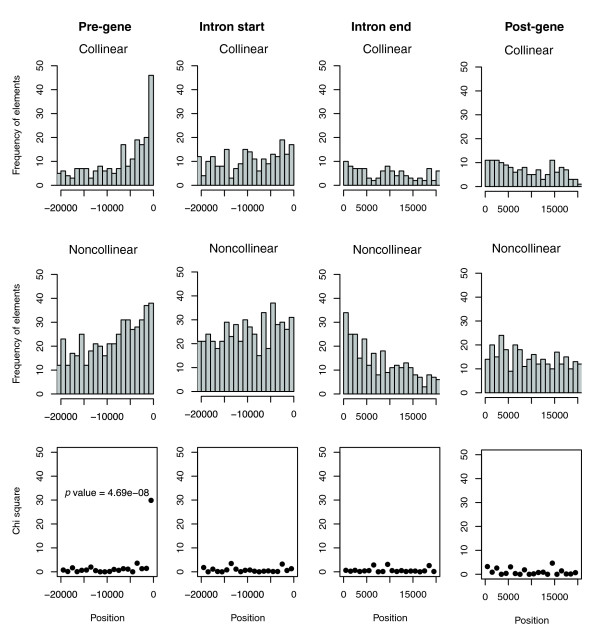
Analysis of SCE shuffling in 1000 bp windows. Each column in the figure shows the analysis of a locus portion (pre-gene, intron-start, intron-end and post-gene) divided into 1000 bp windows. In each column the first graph indicates the number of collinear SCEs identified, the second graph the number of noncollinear SCEs identified, and the third graph the χ2 test used to identify windows that show a significant deviation from the expected proportion of collinear to noncollinear SCEs. The P value is shown for the only window (1000 bp upstream of the transcription start site) that exhibits significant deviation from the expected proportion. bp, base pairs; SCE, shuffled conserved region.