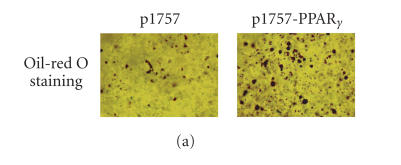
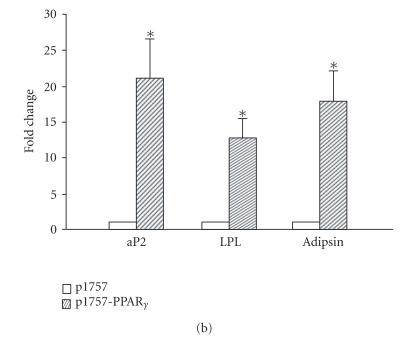
Figure 3.
Adipogenic changes in the growth plate chondrocytes transfected with a PPARγ plasmid under the control of a collagen α1(II) promoter. (a) Growth plate cells were transfected with the p1757-PPARγ plasmid. Transfected cells were maintained in pellet cultures for 10 days, followed by Oil Red-O staining. (b) Quantitative PCR analysis of adipogenic markers of the p1757-PPARγ transfected growth plate cells at day 4 after transfection. Cells transfected with the empty p1757 plasmid were used as controls. Gene expression levels were normalized with respect to endogenous 18S rRNA. * P < .05 versus the expression in control cells.


