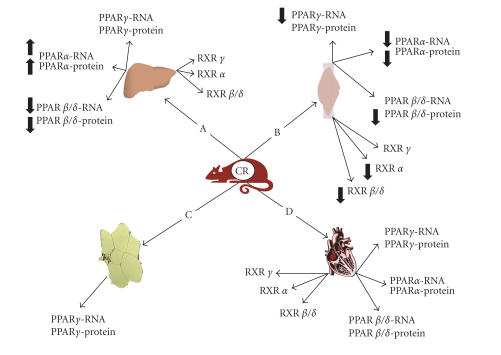
Figure 1.
Effects of calorie restriction (CR) on the expression of PPARs family genes in mouse: (A) liver, (B) skeletal muscles, (C) white adipose tissue, and (D) heart. Arrows pointing up or down indicate statistically significant increases or decreases (P < .05). Lack of arrows means no alteration.

