
Figure 2.
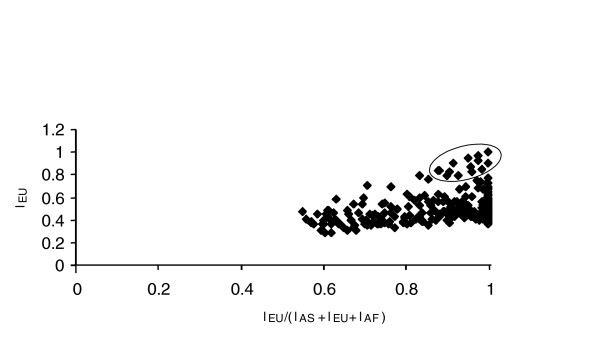
Absolute European locus-specific branch length (LSBL) plotted versus the relative LSBL for each SNP with significant FST (> 0.45); n = 334. Data were from Akey and colleagues [12]. The 23 loci circled in the plot have an EU Absolute LSBL value = 0.8 and were considered in this study as outliers. EU, European-Americans; AF, African-Americans; AS, East Asian.