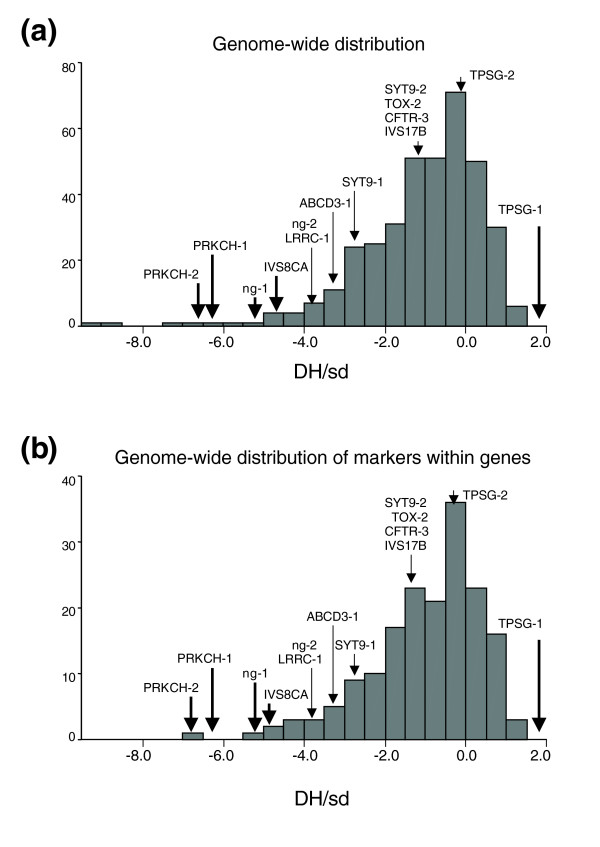
Figure 3.

Empirical distribution of Ewens-Waterson's statistic. (a) Genome-wide distribution of Ewens-Watterson's analysis statistic (DH/sd) generated from 372 dinuclotide microsatellites, distributed through the whole genome (ABI PRISM Linkage mapping Set-MD10). (b) Genome-wide distribution of Ewens-Watterson's statistic generated from microsatellites located within genes. The number of loci is indicated by the Y-axis. The arrows show the Ewens-Watterson score for each microsatellite associated with the genes included in the preliminary test. The microsatellites in bold have significant divergence (PE, Table 1) between observed gene diversity and expected heterozygosity according to the Ewens-Watterson test.
