Figure 1.

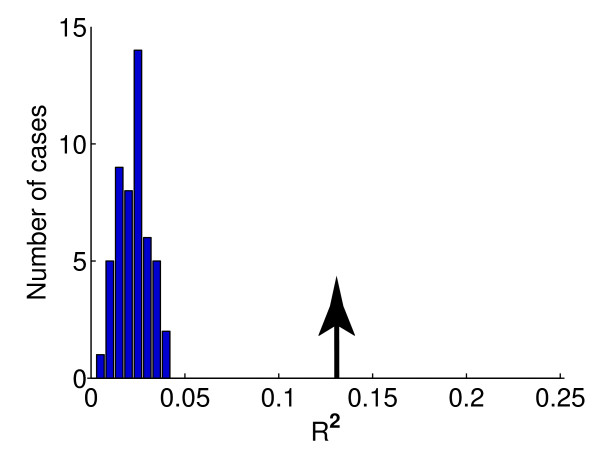
Model validation by comparing the R2 for the real versus randomly permutated datasets. The R2 obtained by applying the motif selection and fitting equation 2 (with sequence motif information only) procedures to randomly permutated and real data. The histogram is obtained based on 50 randomly permutated samples. The arrow on the right marks the R2 for the real data. Results for the coding regions are represented here. See the main text for details.
