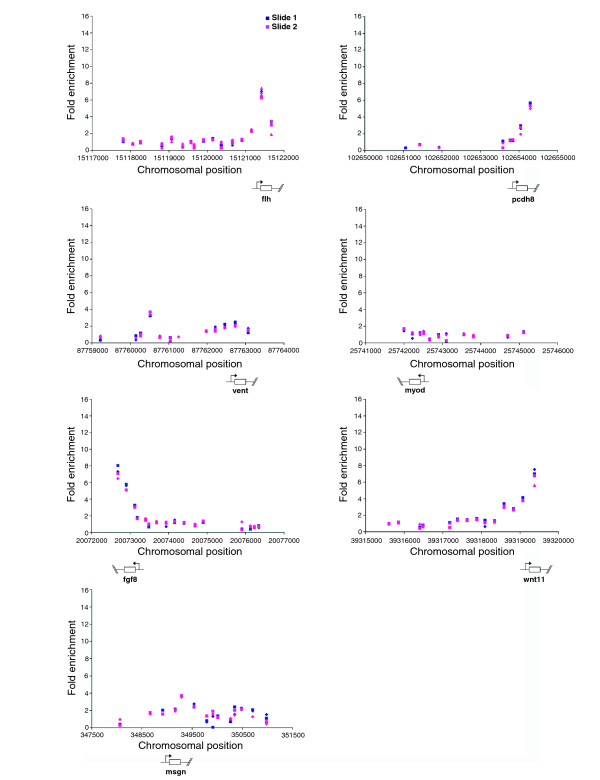
Figure 2.

Positive control replicates show similar enrichment values. For positive control genomic regions each point shows unprocessed ChIP-enrichment ratios for probes on each slide (weighted average across three replicates [58]). The chromosomal position (based on Zv4 genome assembly annotation) is shown below each graph. The x-axes are not to scale.
