
Fig. 3. Analysis of data correlation categorized by p-values from microarray analyses. (A).
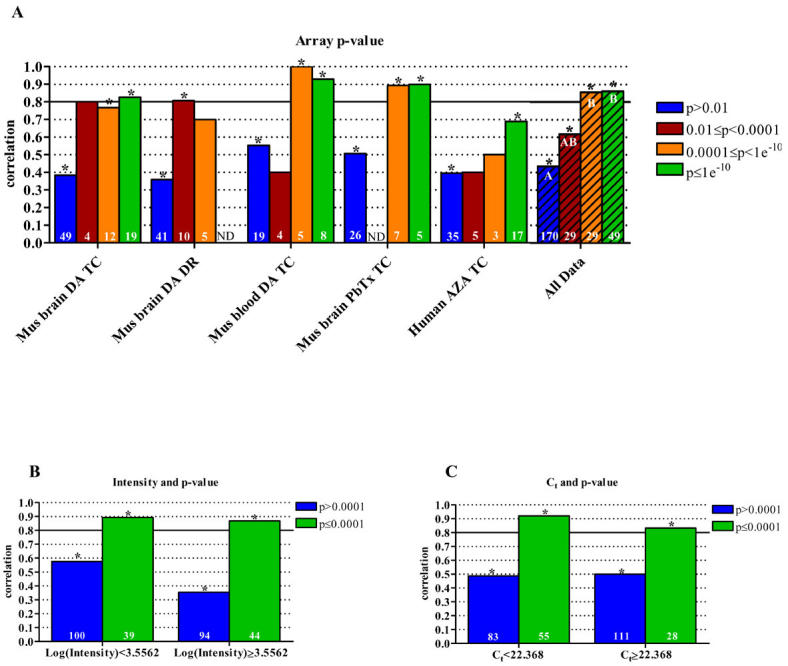
Correlation of microarray and qPCR data as it relates to microarray spot p-values. The combined data set of "all data" was analyzed by (B) spot intensity and (C) Ct values to determine the effect of p-values (0.0001 cutoff) on array and qPCR data correlation. P-values are based on calculations including signal strength, background values, spot morphology, fold change, variation between replicates, etc. Asterisks indicate a statistically significant result (p<0.05). The hatched bars represent the compilation of the five individual data sets, referred to as "all data." Statistical differences of correlations, determined by ANOVA, are indicated by different letters. All correlations were calculated using Spearman’s Rho. The number of samples included in each correlation is shown in the base of the bar. ND, no data (insufficient sample size, n≤2); DA, domoic acid; PbTx, brevetoxin; AZA, azaspiracid; TC, time course; DR, dose response.