
Fig. 6. 3D visualization of microbial biofilms using amira®.
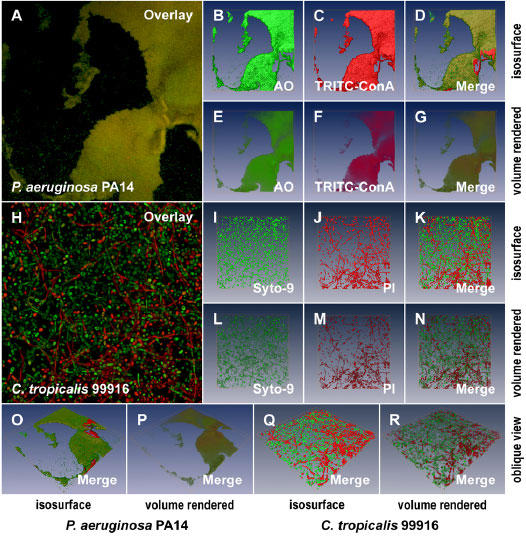
A. A 2D average of an image z-stack for a P. aeruginosa PA14 biofilm stained with AO and TRITC-ConA. B and C. Isosurface rendering of the 3D volume data sets for AO and TRITC-ConA, respectively, extrapolated from the image z-stacks used to create the image in panel A. D. The merged, isosurface rendered 3D volume data set for AO and TRITC-ConA. E to G. Volume rendering corresponding to the data sets presented in panels B to D. H. A 2D average of an image z-stack for a C. tropicalis 99916 biofilm stained with the Live/Dead® cell viability kit. I and J. Isosurface rendering of the 3D volume data sets for Syto-9 and PI respectively, extrapolated from the image z-stacks used to create the image in panel H. K. The merged, isosurface rendered 3D volume data set for Syto-9 and PI. L to M. Volume rendering corresponding to the data sets presented in panels I to K. O and P. The oblique view of the P. aeruginosa PA14 biofilm pictured in panel A visualized using isosurface and volume rendering, respectively. Q and R. The oblique view of the C. tropicalis 99916 biofilm pictured in panel H visualized using isosurface and volume rendering, respectively. Each 2D image panel or 3D model represents a square surface area of approximately 238 × 238 μm.