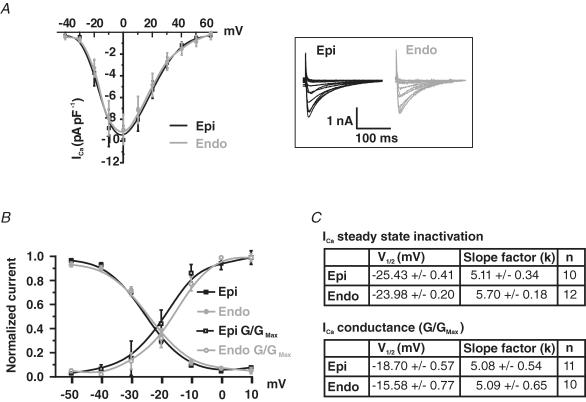
Figure 3. Similar ICa in Epi and Endo cells.
A, current–voltage relationship of ICa in Epi and Endo cells. Representative ICa traces are shown to the right (inset). B, ICa steady-state inactivation is shown as a plot of normalized peak current (I/Imax) as a function of conditioning potential. For the voltage dependence of activation, peak ICa currents at test potentials between −50 and +10 mV were converted into conductances (G = ICa/[test pulse potential – reversal potential of ICa]), normalized (G/Gmax), and plotted as a function of test potential. Smooth lines represent best-fit curves to the data determined by a least-squares method using a Boltzmann equation, y = [(A1− A2)/1 + e(V–V1/2/k)], where A1, A2, V1/2, and k are the initial value, final value, the voltage at which 50% of the current or conductance was observed, and the slope factor. For the steady-state inactivation of ICa in Epi cells A1 = 1, A2 = 0, V1/2 = −25 mV and k = 5. For the steady-state inactivation of ICa in Endo cells A1 = 1, A2 = 0, V1/2 = −24 mV and k = 6. For the conductance–voltage relationship of ICa in Epi cells A1 = 0, A2 = 1, V1/2 = −19 mV and k = 5. For the conductance–voltage relationship of ICa in Endo cells A1 = 0, A2 = 1, V1/2 = −16 mV and k = 5. C, summary of the parameters used to fit the conductance and steady-state inactivation relationships of ICa in Epi and Endo cells. *P < 0.05.

