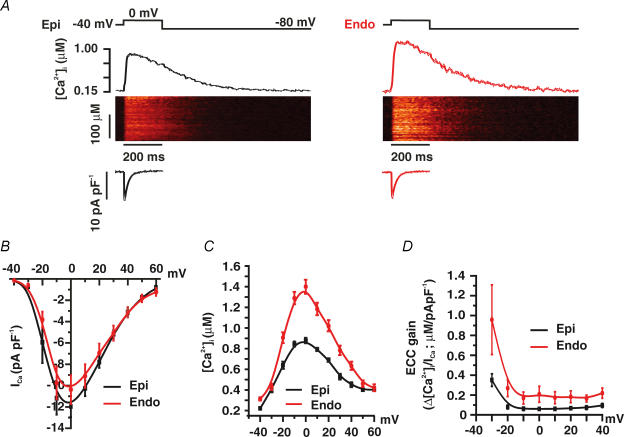
Figure 4. Higher SR Ca2+ release during EC coupling in Endo than in Epi cells.
A, representative ICa and confocal line-scan images from Epi and Endo cells. ICa and [Ca2+]i transients were evoked by a 200 ms voltage step from −40 to 0 mV. Traces showing the time course of ICa and [Ca2+]i in these cells are shown below and above the line-scan images, respectively. B, current–voltage relationships of ICa in Epi and Endo cells. C, voltage dependence of the amplitude of the [Ca2+]i transient in Epi and Endo cells. D, voltage dependence of EC coupling (ECC) gain.

