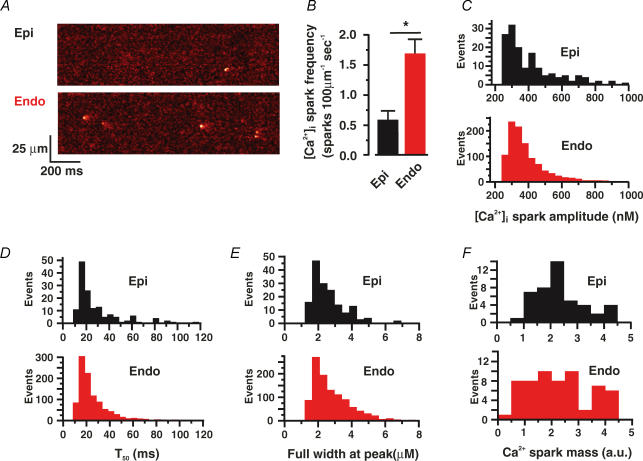
Figure 5. Higher Ca2+ spark activity in Endo than in Epi cells.
A, representative confocal line-scan images from Epi and Endo cells. B, bar plot of the mean ± s.e.m. of the frequency of Ca2+ sparks. Histogram plots of amplitude (C), decay time to 50% amplitude (T50) (D), full width at peak amplitude (E), and Ca2+ spark mass (F). *P < 0.05.

