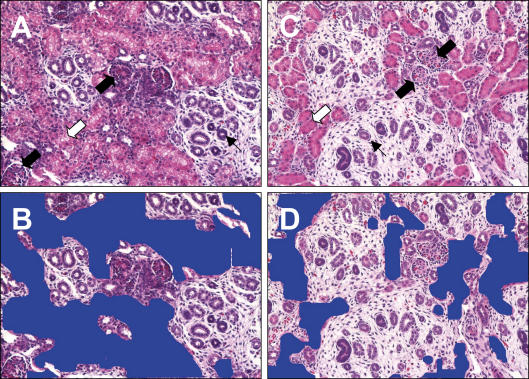
Figure 4. Histological analysis of 90 dG C and NR kidney sections.
Representative photomicrographs (20× magnification) of 5 μm kidney sections from ad libitum fed controls (A) and 30% nutrient restricted (C) baboon fetuses at 90 days of gestation. The area occupied by tubules is represented in blue in the same photomicrographs in control (B) and nutrient restricted (D) animals.

