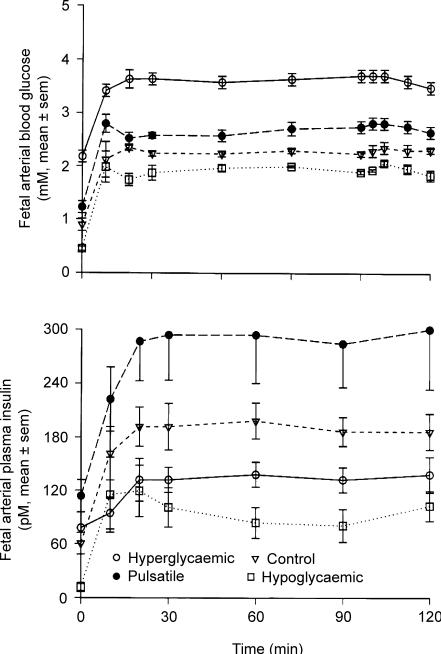
Figure 4. Glucose-stimulated insulin secretion as a function of sustained normal, increased or decreased plasma glucose concentrations in fetal sheep (Hay et al. 1989; Carver et al. 1996).
Four groups of fetal sheep were studied by hyperglycaemic glucose clamp technique after each group had been maintained at a unqiue plasma glucose concentration for 12 days: ▿, control fetuses; ○, fetuses that were markedly and consistently hyperglycaemic (about twice normal); •, fetuses that were mildly hyperglycaemic but had 3 pulses of marked hyperglycaemia lasting 60 min each during a 24-h period; □, hypoglycaemic fetuses that had a plasma glucose about 50% of normal. A, fetal arterial blood glucose concentrations in 4 groups of fetal sheep during a 120 min hyperglycaemic glucose clamp. Values from 30 to 120 min are significantly different (P < 0.01) among all groups. B, fetal arterial plasma insulin concentrations in the same 4 groups of animals during the 120 min hyperglycaemic glucose clamps. Values are means ± s.e.m. From Carver et al. (1996), with permission.

