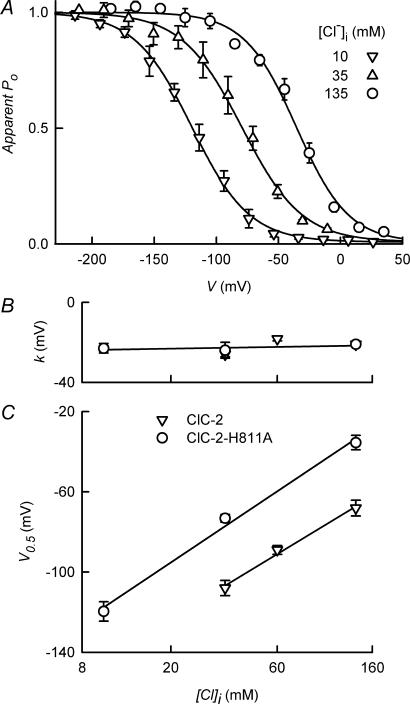
Figure 2. Steady-state activation for ClC-2-H811A.
A, apparent open probabilities, calculated as described in the text, are shown for ClC-2-H811A WT at three intracellular Cl− concentrations. The continuous lines are fits of a Boltzmann equation to the data (see Methods). B and C show the resulting slope factor k and V0.5 values, plotted against [Cl−]i. Values are means ± s.e.m. of 4–7 experiments. Data for wild-type ClC-2 (Catalán et al. 2004) are shown in B and C for comparison.

