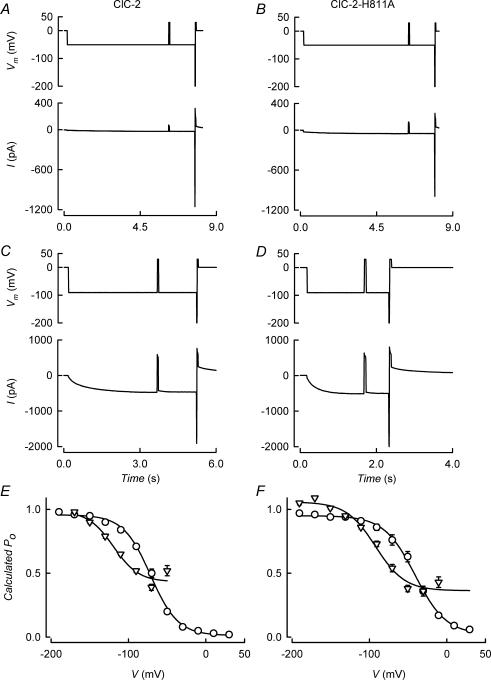
Figure 4. Resolving slow and fast gating processes in the activation of ClC-2 and ClC-2-H811A.
A–D, upper panels, voltage protocols for estimating Ps and Pf values as described in the text. Brief −200 mV pulses are used to evoke full opening of the fast gate without affecting the slow gate and tail currents were obtained by pulsing to 30 mV. Lower panels, currents evoked by the voltage protocols for WT ClC-2 (A and C) and for H811A mutant (B and D) channels. E and F, voltage dependence of the deduced Ps (▿) and Pf (○) values for ClC-2 (E, means ± s.e.m., n = 9) and ClC-2-H811A (F, means ± s.e.m., n = 6) channels.

