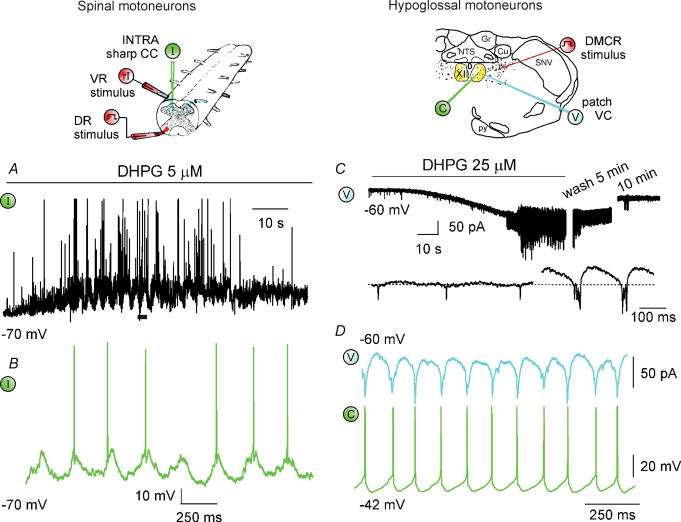
Figure 2. Cellular actions of group I mGluR activation.
Left (top), schematic diagram showing the electrophysiological arrangements used for the rat isolated spinal cord preparation with sharp electrode intracellular recording (I; green) from lumbar motoneurons, DR electrical stimulation (step symbol; red) and ventral root (VR) antidromic stimuli to elicit recurrent IPSP (rI; red). A, application of DHPG induces membrane depolarization (with associated input resistance rise), membrane oscillations and enhancement in synaptic activity (large deflections are truncated spikes). B shows faster time base record of motoneuron oscillations with spikes taken from the trace marked by filled bar (voltage calibration in B applies also to A). Data are reproduced with permission from Marchetti et al. (2003, 2005). Right (top), schematic coronal section of the brainstem to show location of patch clamp electrode (under voltage clamp, VC, blue; current clamp, CC, green) for recording from HMs. The stimulating electrode is placed in the DMRC as shown (step symbol, red). C, under VC conditions application of DHPG induces inward current with emergence of fast oscillations and subsequent bursts; 10 min washout restores control conditions. Faster time base record taken from the trace depicts fast oscillations subsequently followed by bursts. D, paired recording from adjacent HMs shows strong phase coincidence of DHPG-evoked oscillatory patterns under voltage (top) and current (bottom) clamp. Data are reproduced, with permission, from Sharifullina et al. (2004, 2005).

