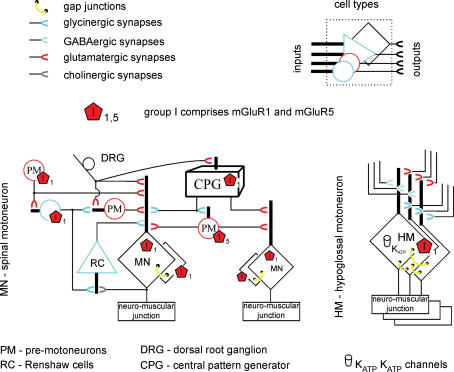
Figure 4. Idealized diagram of motor networks activated by group I mGluRs.
Different types of neuron are indicated by dissimilar cell body shapes: their inputs are compacted into a single dendritic shaft, while their output is indicated by a horseshoe symbol colour-coded according to the released transmitter. Group I mGluRs (mainly found at extrasynaptic sites) are assigned on the basis of cell type rather than specific cell compartments. Left, schematic representation of spinal networks (one side only of the segmental circuit is shown) with excitatory (glutamatergic, red; cholinergic, grey), inhibitory (GABAergic, light blue; glycinergic, dark blue) and electrical (yellow) synapses. CPG interneurons are collectively lumped into a black box with inputs from DRs, and output to premotoneurons and motoneurons. mGluR1 and mGluR5 receptors (red pentagons) are expressed by various cell types. While mGluR5 activity is believed to generate motoneuron oscillations, mGluR1 activity is thought responsible for network depolarization (including CPG elements and motoneurons). Gap junctions and depression of Renshaw cell activity probably concur to produce oscillation synchronicity. Note that facilitation of glycinergic interneuron (blue circle)-bearing mGluR1 receptors contributes to restrain network excitation. Right, network of HMs bearing mGluR1 receptors and coupled via gap junctions. HM expression of KATP channels enables pacing of bursting at low frequency. Network synaptic inputs important for oscillatory activity are also shown. Note apparent lack of mGluR5 receptors.

