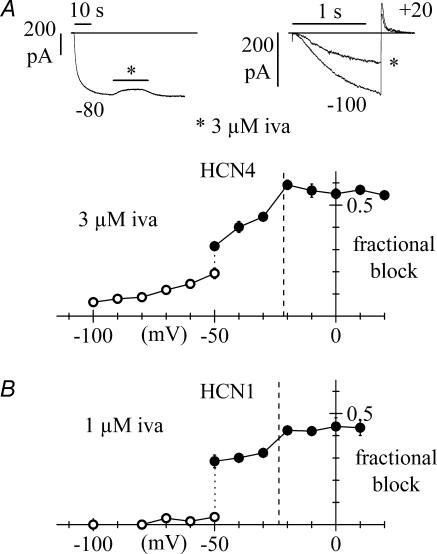
Figure 7. Voltage-dependence of steady-state block of HCN4 and HCN1 channels by ivabradine.
Data are plotted as mean ± s.e.m. averaged from 3–13 cells (A, HCN4) or 3–5 cells (B, HCN1). For both curves, at voltages equal to or more negative than −50 mV the current was activated by long steps to test potentials and the drug perfused until full block development. Fractional block was measured as the ratio between blocked and control current amplitudes (○). At voltages equal to or more positive than −50 mV, the membrane was held at the test voltage and a fixed activating voltage step to −100 mV (A: 1.2 s; B: 0.5 s) was applied repetitively (1/6 Hz). Fractional block was then measured for each test voltage as the ratio between blocked and control current at −100 mV at steady-state (•). Vertical dotted lines correspond to the mean reversal potentials measured from fully activated current–voltage relations (HCN4: −21.3 ± 1.5 mV, n = 5; HCN1: −23.5 ± 1.7 mV; n = 4). Upper panels in A represent sample IHCN4 traces for the block protocols at −80 mV (left) and +20 mV (right: asterisk indicates current at steady-state block).

