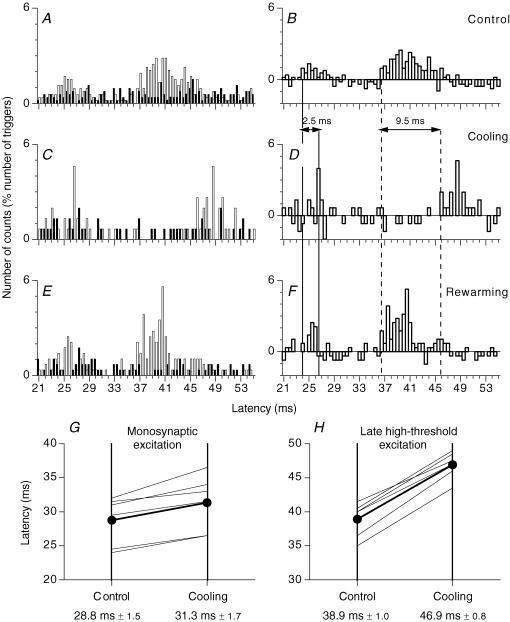
Figure 4. PSTHs for a FDS motor unit: effects of cooling the ulnar nerve.
A–F, PSTHs for the same FDS unit. Histograms in A, C and E, recorded with and without stimulation, as in Fig. 1A and C, and those in B, D and F representing the difference as in Fig. 1B and D. PSTHs are compared after electrical stimulation of the ulnar nerve at wrist level in the control situation (A and B), after cooling (13 min) of the ulnar nerve (C and D, the small excitation at 25–25.5 ms is not significant) and after rewarming (E and F). (Calculations for heteronymous monosynaptic latency: median – induced monosynaptic latency, 20 ms; distance wrist–elbow, 0.27 m; supplementary afferent conduction time for the ulnar Ia volley, 3.9 (0.27/69) ms; ulnar-induced heteronymous Ia excitation expected at 23.9 (20 + 3.9) ms, corresponding to the latency (24 ms) of the early peak in B). Vertical lines indicate the latency before and after cooling of heteronymous Ia excitation (thick continuous vertical lines) and late high-threshold excitation (dashed lines). Horizontal double-headed arrows: delay caused by nerve cooling in the latencies of the two peaks of excitation. G and H, group data (6 FDS units). Each thin line represents one unit, and the thick lines (and •) represent the mean values for the group. The latency (ms) of the monosynaptic Ia (G) and late high-threshold peak (H) evoked in PSTHs are compared before (left vertical bar) and after cooling (right vertical bar). Mean (±1 s.e.m.) values in the group are shown beneath each corresponding vertical line.

